

AutoICE
Challenge closed
Objective of the Challenge
The objective of the AutoICE challenge is to advance the state of the art for sea ice parameter retrieval from SAR data and to result in an increased capacity to derive more robust and accurate automated sea ice maps. Challenge participants are tasked to build machine learning models using the available challenge dataset and to submit their model results for each of the three sea ice parameters: sea ice concentration, stage-of-development and floe size.
The challenge dataset
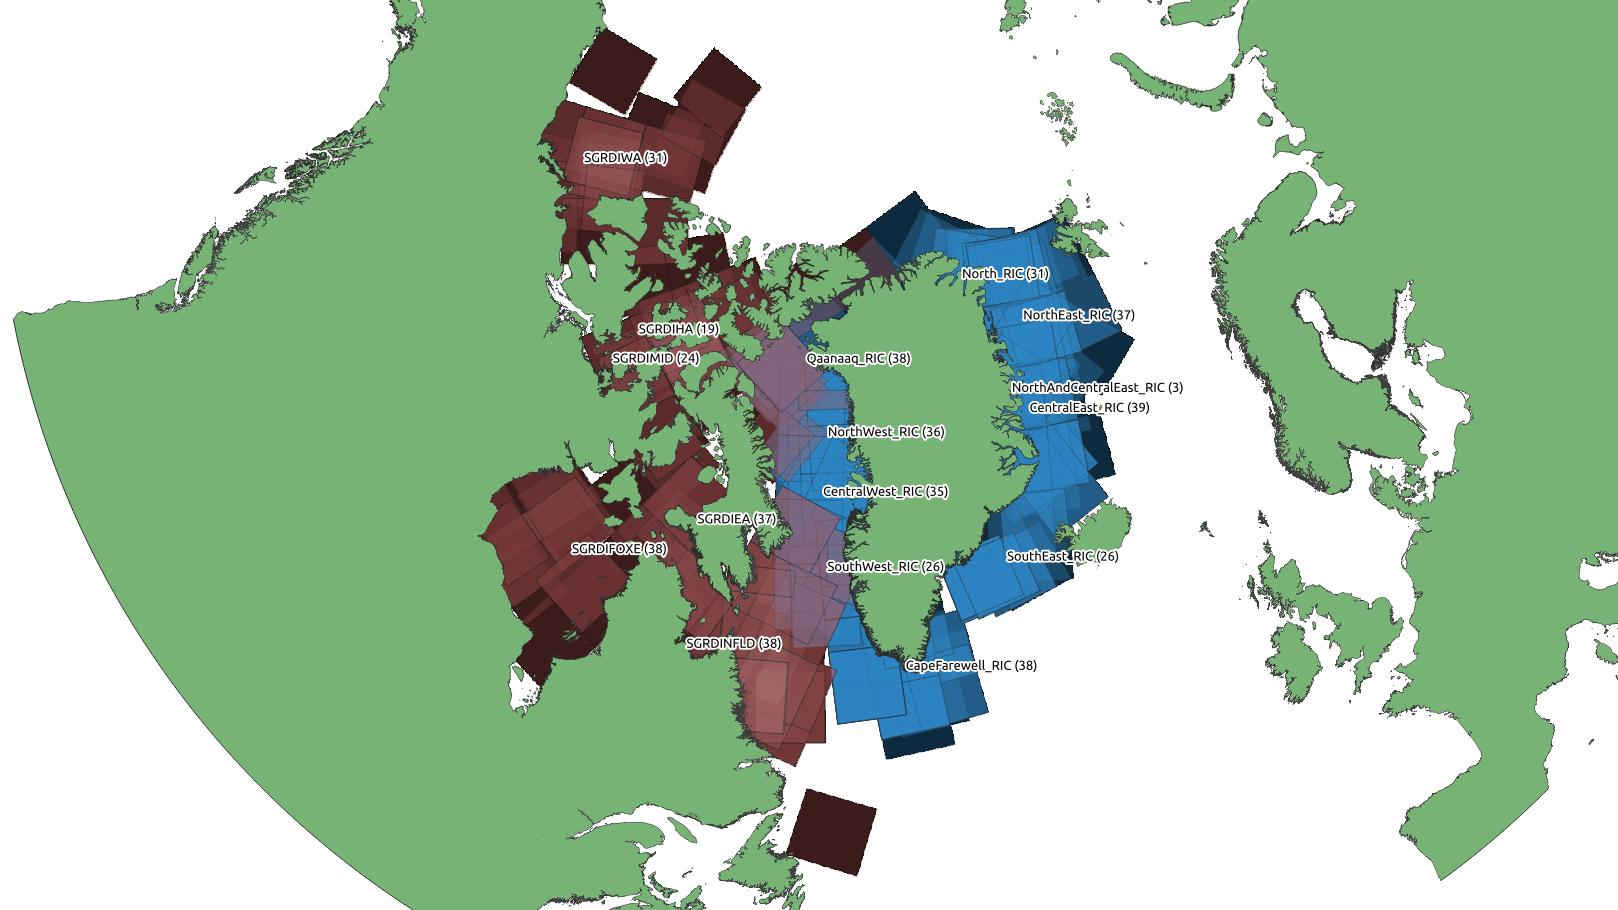
The training dataset made available in this challenge contains Sentinel-1 active microwave (SAR) data and corresponding Microwave Radiometer (MWR) data from the AMSR2 satellite sensor, to enable challenge participants to exploit the advantages of both instruments. While SAR data has ambiguities, it has a high spatial resolution, whereas MWR data has good contrast between open water and ice. However, the coarse resolution of the AMSR2 MWR observations introduces a new set of obstacles, e.g. land spill-over, which can lead to erroneous sea ice predictions along the coastline adjacent to open water. Label data in the challenge datasets are ice charts produced by the Greenland ice service at the Danish Meteorological Institute (DMI) and the Canadian Ice Service (CIS). The challenge datasets also contain other auxiliary data such as numerical weather prediction model data.
Two versions of the challenge dataset exist, the 'raw' and the 'ready-to-train', with corresponding test datasets. The dataset consists of 493 training and 20 test (without label data) data files. The ready-to-train dataset is a post-processed version of the raw dataset (with downsampling from 40 to 80 m pixel spacing, standard scaled, converted ice charts (sea ice concentration, stage of development and floe size), removal of nan values, mask alignment etc).
The datasets are described in detail in the common manual that is published together with the datasets:
The challenge datasets are available through this DOI (published on data.dtu.dk):https://data.dtu.dk/collections/AI4Arctic_Sea_Ice_Challenge_Dataset/6244065
Participants are free to choose which of the two challenge datasets - the raw or the ready-to-train - they want to use for developing their solutions. However, the submission will have to be delivered in 80 m pixel spacing, to be evaluated correctly on the leaderboard.
Getting Started tools
To help participants to get started with the challenge, the organizers have prepared a Jupyter notebook (Starter Pack) to guide you through the data I/O, visualization, prediction using a baseline algorithm, and creating a valid submission. Please find the starter pack including the Jupyter notebook: https://github.com/astokholm/AI4ArcticSeaIceChallenge
Available computing resources
A limited amount of machine learning computing resources will be made available to challenge participants on Polar TEP. The resources can be accessed at: https://autoice.hub.eox.at/. More information about the computing resources availability and limitations can be found on the platform upon registration.
Polar TEP (polartep.polarview.org) provides a complete working environment where users can access algorithms and data remotely, providing computing resources and tools that they might not otherwise have, and avoiding the need to download and manage large volumes of data. Polar TEP has implemented the MLflow platform to support machine learning activities. MLflow is an open-source platform to manage all stages of the ML lifecycle, including experimentation, reproducibility, deployment, and a central model registry. MLflow offers four components:
MLflow Tracking
The MLflow Tracking component is an API and UI for logging parameters, code versions, metrics, and output files when running your machine learning code and for later visualizing the results. MLflow Tracking lets you log and query experiments using Python, REST, R, and Java APIs.
MLflow Tracking uses the concept of runs, which are executions of some piece of data science code, e.g., Trained models. MLflow Tracking supports autologging for many classic libraries such as TensorFlow, Scikit-Learn, Spark or Pytorch. Runs can be stored as local files, remote server or into an SQLAlchemy compatible database. The tracking UI allows to directly visualize tracked metrics and search for the best components.
MLflow Projects
An MLflow Project is a format for packaging data science code in a reusable and reproducible way. In addition, the Projects component includes an API and command-line tools for running projects, making it possible to chain together projects into workflows.
Each project could be a git repository or directory with a code to run. In the MLproject file it is possible to define the software environment and entry points with parameters.
MLflow Models
An MLflow Model is a standard format for packaging machine learning models that can be used in a variety of downstream tools—for example, real-time serving through a REST API or batch inference on Apache Spark. The format defines a convention that lets you save a model in different “flavors” that can be understood by different downstream tools.
Flavors allow MLflow Models to be treated with corresponding functions without the need to integrate tools with each library. Flavors can be defined in the MLmodel file. Model signatures are defining outputs and inputs needed for deploying models as a REST API. The Model API allows saving, loading and logging of the model also as adding different flavors. MLflow also provides an evaluate API to evaluate previously built models on one or more datasets.
MLflow Model Registry
The MLflow Model Registry component is a centralized model store, set of APIs, and UI, to collaboratively manage the full lifecycle of an MLflow Model. The MLflow Model Registry works both in UI and API version. It provides model lineage (which MLflow experiment and run produced the model), model versioning, stage transitions (for example from staging to production), and annotations. Model versioning allows models to be archived and redeployed in the future.
Metrics and scoring
Challenge participants are tasked to submit their model results for each of the three sea ice parameters:
- sea ice concentration
- stage-of-development
- floe size
The following quantitative statistical metrics will be used in the individual evaluation of the three sea ice parameters:
- sea ice concentration (SIC) submissions will be evaluated by calculating the R2 coefficient. R2 captures the regression-aspect of sea ice concentrations (inter-class relationship i.e. 10% SIC being closer to 20% than to 30%) and can be expressed as a percentage. It is formulated as:
$$
R^2 = 1 - \frac{\sum_{i=1}^{N_{pixel}}(y_i^{true} - y_i^{pred})^2}{\sum_{i=1}^{N_{pixel}}(y_i^{true} - \hat{y}_i^{true})^2}
$$
where $y_i^{true}$ is the true $i^{th}$, $\hat{y}_i^{true}$ is the mean true pixel value, and $y_i^{pred}$ is the predicted class of the $i^{th}$ pixel. The score is calculated on two 1D-arrays containing all the testing scene pixels. We express the $R^2$-score as a percentage by multiplying with 100. We use the sklearn Python $R^2$ function: https://scikit-learn.org/stable/modules/generated/sklearn.metrics.r2_score.html
- Stage-of-development (SOD) and Floe size submissions will both be evaluated using the F1 score. Opposite sea ice concentration, stage-of-development and floe size categories are not directly linked and thus a classification-oriented metric is suitable for this evaluation. F1 is based on precision and recall and takes dataset sea ice class imbalance into consideration. The F1 score is also expressed as a percentage. The score is formulated as:
$$
F1 = 2 \frac{precision \cdot recall}{precision + recall}
$$
where precision ($P$) and recall ($R$) are given as:
$$
P = \frac{T_P}{T_P + F_P}
$$
$$
R = \frac{T_P}{T_P + F_N}
$$
where $T_P$ is the number of predicted true positives, $F_P$ the number of false positive and $F_N$ the number of false negatives. We use the sklearn Python F1 function: https://scikit-learn.org/stable/modules/generated/sklearn.metrics.f1_score.html
The three sea ice parameter scores will be combined into one single final score as defined in the weighting scheme illustrated in Table 1. When deriving the final score, SIC and SOD will be weighted over floe size, following the challenge expert team’s input on the relative importance of the three parameters when ranked. An advantage of using the R2 and F1 scores is that they range from 0 to 1, that they can easily be combined following the below weighting scheme, and that the final score can be converted into a percentage for use on the AI4EO.eu leaderboard. Participants ranking in the challenge will be decided by the final score of their submissions which is shown on the leaderboard.
If participants fail to submit a result for one or two of the three sea ice parameters, this will set the individual score for the missing sea ice parameter(s) result(s) to 0 (i.e. R2 or F1 equal to 0) and it will affect the final score with the weight of that parameter.
| Sea ice parameter | Metric | Weight in total score |
|---|---|---|
| Sea ice concentration | R2 | 2/5 |
| Stage of development | F1 | 2/5 |
| Floe size | F1 | 1/5 |
Table 1: The metrics for the three sea ice parameters and their weight in the final score.
The ice chart label data provided in the challenge dataset follows the World Meteorological Organization (WMO) code for sea ice classes. The raw training dataset contains all the sea ice class codes that are available from the ice charts. Due to some ice chart classes being underrepresented and for making the challenge task simpler for participants, the project team has reduced the number of ice classes (some classes are combined, where relevant) in the ready-to-train dataset. The ice chart classes that apply to the three sea ice parameters targeted in the challenge are shown in the below tables for SIC in Table 2, for SOD in Table 3 and for FLOE in Table 4. Participants’ submissions have to comply with the “class” labels in Table 2 to 4, right column, to be evaluated correctly on the leaderboard. For more information about how to create and submit a solution, see the Rules page.
The submissions for each sea ice parameter will be evaluated against the corresponding label data (only available to organizers) on a grid level (80 m pixel spacing) for the challenge ice classes:
- SIC submissions will be compared against the ice chart total ice concentration (Table 2) on pixel level.
- SOD submission will be compared against ice chart stage-of-development classes (Table 3) on pixel level, but only for pixels in the label ice chart data where a SOD class is dominant (this means that the partial ice concentration of that SOD class is >=65% of the total ice concentration in that ice chart pixel. Ice chart pixels in the test scenes label data that do not have a dominant SOD class will not be used in the SOD evaluation).
- FLOE size submissions will be compared against ice chart floe size classes (Table 4), but only for pixels in the label ice chart data where a FLOE class is dominant (this means that the partial ice concentration of that Floe size class is >=65% of the total ice concentration in that ice chart pixel. Ice chart pixels in the test scenes label data that do not have a dominant FLOE class will not be used in the SOD evaluation).
More information about the training dataset content and the ice chart class codes can be found in the Dataset manual that is published together with the datasets.
| Sea Ice Concentration | Class |
|---|---|
| Open water | 0 |
| 1/10 | 1 |
| 2/10 | 2 |
| 3/10 | 3 |
| 4/10 | 4 |
| 5/10 | 5 |
| 6/10 | 6 |
| 7/10 | 7 |
| 8/10 | 8 |
| 9/10 | 9 |
| 10/10 | 10 |
Table 2: Sea ice concentration classes targeted in the challenge.
| Stage of development | Class |
|---|---|
| Ice Free | 0 |
| New Ice | 1 |
| Young ice | 2 |
| Thin First-year ice | 3 |
| Thick First-year ice | 4 |
| Old ice | 5 |
Table 3: Stage of development classes targeted in the challenge.
| Floe size | Class |
|---|---|
| Ice Free | 0 |
| Ice cakes | 1 |
| Small floes | 2 |
| Medium floes | 3 |
| Big floes | 4 |
| Vast & Giant floes | 5 |
| Icebergs & Growlers | 6 |
Table 4: Floe size classes targeted in the challenge.
Leaderboard
The submitted entries will be ranked based on the metrics as outlined above. When the challenge closes, the final ranking will be shown on the leaderboard. The final score on the platform leaderboard will decide the winners of the challenge. However, the organizers will do a final check of the submissions and if any concerns about the validity of the solution arise, the organizers reserve the right to contact the team leader of the corresponding team to resolve such issues. If the issues cannot be resolved, the team will not be eligible to receive prizes. The winners will be officially announced following the challenge closure.