

MapYourCity
Challenge closed
The data
Already have an idea and want to get started? Don’t worry, the data is on us! To give you the freedom of focusing on your solution, we provide you with all necessary data and tools from a variety of applications.
1. Building Footprints and reference construction time information
Building footprints are extracted from EUBUCCO, a scientific database of 200+ million individual building outlines from all 27 European Union member state countries plus Switzerland, which has been generated by harmonising more than 50 authoritative datasets. Together with individual building footprints, EUBUCCO provides three main attributes –type, height and construction year – included for respectively 45%, 74%, and 24% of all buildings in the database.
2. Georeferenced street-level imagery from Mapillary and MindView
Mapillary is a platform that gathers street-level imagery from user-contributed devices with GNSS and imaging features, such as smartphones or action cameras. The dataset is made available for public use, either through Mapillary's API or by manual downloading from the platform.
MindView is a crowd-based system developed by MindEarth, which enables to collect panoramic street-level images using proprietary field survey devices featuring off-the-shelf affordable 360-degree cameras. MindEarth’s AI-powered platform performs GDPR-compliant anonymization of faces and licence plates.
Example images street-view image dataset:
The images below show buildings/ houses from the first and last classes, i.e. Class 0 which is “< 1930” and Class 6 which is “> 2006”.
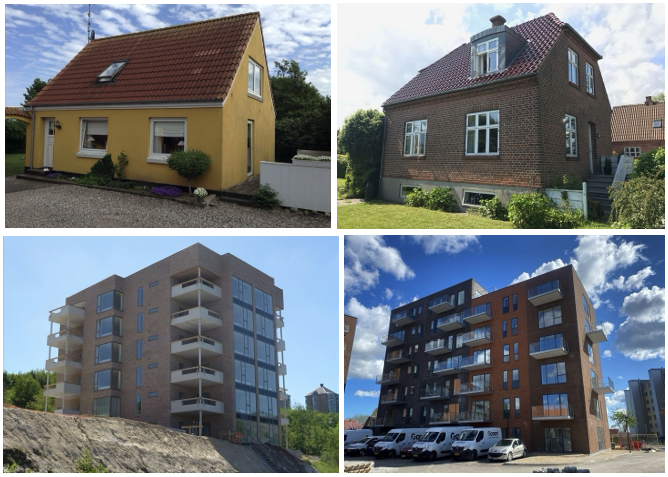
The new dataset consists of several images of building facades in Europe, organised in folders and classified in 7 classes corresponding to their respective construction epochs.
3. VHR orthophoto and satellite imagery
Publicly accessible orthophotos are gathered from different National Geoportals with spatial resolution in the range of 7-20cm. Wherever not freely available, VHR satellite Pleiades imagery from the ESA Third Party Mission (TPM) programme has been used. For consistency, all data have been rescaled to 50cm resolution.
Example images for the top-view image data:
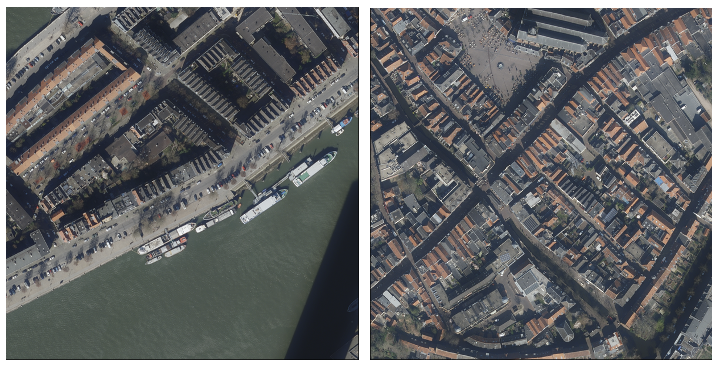
Top-view images are centred on the house or building of corresponding street-view images.
4. Sentinel-2 imagery
RGB cloud-free Sentinel-2 imagery from Copernicus is gathered at 10m resolution, which enables to perform effective analyses of the built-up environment at the neighbourhood level.
The database including all above-mentioned information is hosted on the Earth Observation Training Data Lab (EOTDL) with easy access through a command line interface and the possibility of free GPU cloud computing. Notebooks from ESA will show users a baseline example of applying common machine learning models to the street view data.
To get started, you can find a starter toolkit (Jupyter notebook) here:https://github.com/AI4EO/MapYourCity
The dataset is divided into 2 collections, a training and a test set. For each of these, a csv file is provided with a list of corresponding labelled building IDs (pid). Information on the exact building location has been removed; nevertheless, unreferenced country and city IDs are provided. For training data, the following information is provided:
- construction year binned in 7 age groups, namely <1930, 1930-1945, 1946-1960, 1961-1976, 1977-1992, 1993-2006, >2006 [TXT format];
- the closest street-view image best depicting that building’s façade [JPEG format, 512x1024 pixels];
- a cloud-free RGB 50 cm-resolution top-view patch (256x256m) centred at the building façade [TIFF format, 512x512 pixels];
- a cloud-free RGB 10 m-resolution Sentinel-2 image patch (520x520m) centred at the building façade [TIFF format, 520x520 pixels].
Street-level imagery of the test data is only provided for two cities. Provided data for other geographical locations is limited to top-view VHR, orthographic and Sentinel-2 imagery.
Metrics and evaluation procedure
Classification task setup:
To examine and assess model generalisation, we use a leave-cities-out evaluation methodology. Specifically, we leave 4 cities out from training so that we can evaluate the models on these held-out cities and test the generalisation performance.
In this way, we examine the impact of region/ city change on the inference performance of the models.
- Classes: Construction year: 7 classes. Class labels: 0 to 6
- Tags: Countries and cities: 6 countries and 19 cities in Europe
- Our problem setting: Class and tag imbalance
Evaluation of the models:
The distribution of the error: Does the error have a bias towards old houses or new buildings?
Does the error have a bias towards specific cities and/or countries?
Suggestions for participants
Before you dive right into the challenge, we have collected a set of suggestions for you to kick-start you into the right direction.
1. Because the models will be evaluated on left-out cities, the validation set can have a held-out city. In this way, it is possible to have a similar evaluation-like procedure in the validation set. The validation set is used for hyper-parameter tuning and for early stopping.
2. Regression rather than classification with the cross-entropy loss function can be performed, and this could potentially perhaps improve the model performance.
3. Segmentation can be performed as an initial step so that the training is done with only the useful information for the network. Segmentation to isolate the desired building can potentially improve the performance.
4. Use of K-fold classification with, for example, K = 10 folds to improve performance. Also, perform advanced regularisation techniques to prevent overfitting on the cities included in the training data, in order to be able to generalise to new/ previously unseen cities and/or countries in Europe.
5. Address the issue of having a high error when the samples from the specific city or country are limited in number: Use of data augmentation mainly for the few-sample cities and/or countries. Perform learned data augmentation using for example deep generative models, e.g. diffusion models, Generative Adversarial Networks (GAN), or flow-based models. Advanced data augmentation methods like generative models could improve the generalisation performance of the model. Further data augmentation to be considered: Change/ alter the colours of the outside walls/ facade of the buildings. Random/ stochastic data augmentation, e.g. Gaussian blur, colour jitter, and small-angle rotation, can also be performed. Here, dense random sampling can produce several samples for the limited-data cities and/or countries, while less dense random sampling can produce additional samples for the several-data cities.
6. Use of model ensemble to improve performance and show that using aerial and satellite images has benefits in this setting. Training an ensemble based on/ considering the correlations between countries, rather than just training a single model, might potentially lead to improved performance. See also (7) below.
7. Use of city information during training to improve performance, i.e. the country and city information can be used during training. Training different models and combining cities: Training a model ensemble by combining cities based on performing clustering in the feature space using a similarity metric to define the numerical criterion to combine cities, can improve performance. Here, using the t-SNE or the umap algorithms to find correlations in the feature space between cities and/or countries in order to effectively combine cities can lead to benefits.
8. Because of sometimes limited data for some cities and/or countries, consider the use of decision trees, including Random Forests. Such machine learning methods that are non-deep-learning-based models, i.e. non-neural-network-based, might show improved performance in the examined problem settings. Logistic regression for classification can also be examined/ considered.
If you have additional questions regarding the data set or metrics, the forum is available and data expert will help !