

ClearSAR-Track 1
Challenge closed
Data objective of the Challenge:
The objective is to build a method, based on the provided training set of quicklooks (RGB images in a png format) accompanied by ground-truth annotations (bounding boxes), to detect & localize RFI in quicklook images. RFI objects are of different characteristics – these difficulties are reflected in the released dataset.
The dataset:
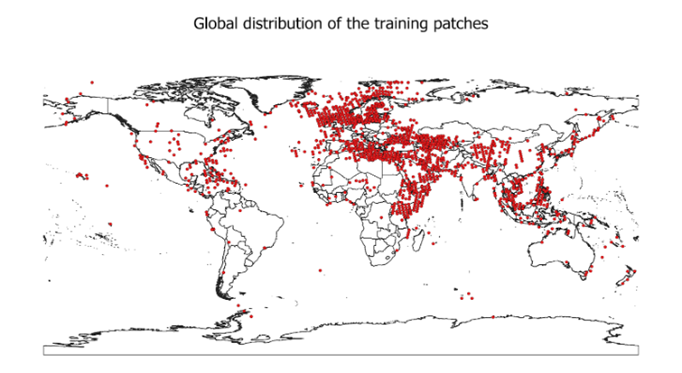
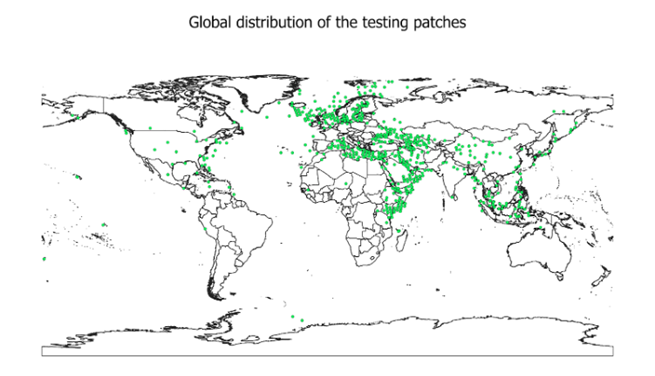
The participants are provided with the AI-ready dataset (RFI dataset), comprising 3,940 quicklook (RGB) images. The dataset was divided into training and test sets based on multiple criteria to ensure balanced representation across geographic regions (Figure 1), RFI sizes, and types of interference.
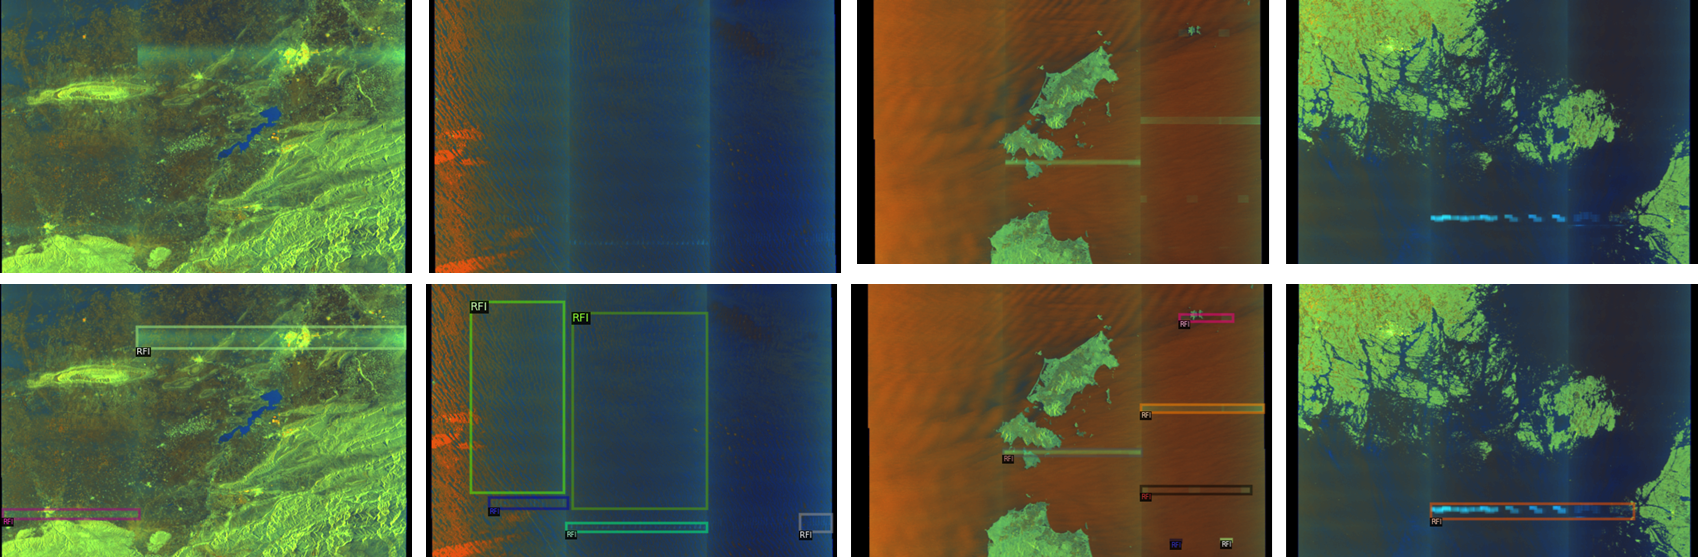
The training set contains 3,154 images, accompanied with the ground-truth annotations (bounding boxes showing RFI artifacts – see examples in Figure 2), whereas the test set contains 786 images. Furthermore, the validation set includes 50% of test images.
Metrics used during the Challenge:
The score obtained by a Team is calculated using mean Average Precision (mAP). It is calculated at 10 Intersection-over-Union (IoU) thresholds of .50:.05:.95, and mAP ranges from 0 to 1, with 1 indicating the perfect score.
The script used to calculate mAP is released as part of the Starter Pack.
Leaderboard
The submitted entries will be ranked based on the mAP metric (the higher, the better).
To reduce the probability of over-fitting to the test set, the participants will only see their results obtained over a subset of the entire test set (50% of all test samples), referred to as the validation set.
When the challenge closes, the final ranking will be re-computed based on the entire test set. This may lead to changes in the final ranking positions, since mAP on the validation set – being a subset of 50% test examples – may differ from mAP obtained over the entire test set.
Thus, the public leaderboard shows the results of 50% of all test samples, and the final ranking is re-computed over the entire test set.
Getting started
To help participants get started with the challenge, we prepared a Jupyter notebook (Starter Pack) to guide teams through the data I/O, visualization, prediction using a baseline algorithm, and creating a valid submission.
Follow this link to access the dataset:
https://www.eotdl.com/datasets/ClearSAR
From there you can stage the dataset directly using the following CLI command:
- pip install eotdl
- eotdl datasets get ClearSAR
If you need further support on how to stage a dataset from EOTDL, please refer to the tutorial notebook provided here: https://www.eotdl.com/docs/datasets/stage
Need Help?
Join the discussion forum, ask questions, or reach out through the official support channels provided with the Challenge. We’re here to help.